रेड क्रॉस
Red Cross
My roles
Research Lead
Team
16 teammates from 5 Disciplines
Tools
Figma
Miro
Duration
10 weeks
रूपरेषा
Overview
With Hurricane Helene hitting Savannah, it was the city’s first major hurricane after 46 years, with the last one being Hurricane David struck as a category 1 in 1979. With phenomena such as climate change, such disasters are expected to be more common. The American Red Cross reached out to us to create a solution for an area which had never experienced disasters before.


My role
Research Lead: Lead the research team and facilitated taking research-backed design decisions. Help communicate research to clients and guide team members with visual storytelling.
This video covers what we worked on and presented the final solution as. We feel grateful that the American Red Cross decided to cover and publish more about this initiative!
ओझरतं
Sneak Peak


Reimagining Disaster Relief for Chatham County
परिस्थिती समझणे
Understanding context
In the past 10 years, there have been more category 4 and 5 hurricanes than the last 50 years.

70% increase
In billion dollar disasters

8.5 Million
People displaced

2X increase
In relief operations
The Community Adaptation Program (CAP)
Seeing these alarming statistics, the American Red Cross aimed to help Hyperlocal Organizations (Organizations which operate in a small geographical space) to provide aid as soon as possible.
The goal of the program was to provide resources that these hyperlocal organizations don't have access to in the following factors:

Health

Hunger

Housing
संशोधन
Research
As the research lead, it was my responsibility to collect data and provide useful insights which the team can use. For this project, my team conducted both primary and secondary research.
Secondary Research
Before the assignment officially kicked off, each team member was tasked to research and familiarize themselves with the assignment scope.

Collecting all data points from 16 student documents
To avoid repetation, the research team compiled all of this information and organized them into qualitative, quantitative, and information given to use by the American Red Cross.

Organizing all our research points on the timeline
Next, we further segregated the data points with context to where that information can be useful (before and after a disaster occurs). Then, we further divided these data points on common themes and patterns we observed by analyzing the data.
Primary Research
After organizing all the secondary data points, we wanted to validate our findings through our primary research. We conducted a large scale survey with participants all across the globe as well as interviews from people who were impacted the most by Hurricane Helene in Chatham County.
Survey Demographics

150+
Survey respondents

20
States

9
Countries
Impactful survey results
8 in 10
Do not seek help from non-profit organizations post disaster
7 in 10
Did not feel informed about the available resources in their area
6 in 10
Do not consider preparing for a natural disaster unless it is an immediate threat
Some interview quotes
“It’s scary to stay, it’s scary to leave”
"Being an international student, I was on my own in a completely new environment. When the hurricane hit, I was in my apartment basement with a flashlight. The lights were out, and all my plans were cancelled. I didn't know what to do."
माहितीचे वापर
Analysis

After all the research, we went back to the drawing board and sat together to create a central idea around which we would design solutions. There were a lot of back and forths, since Chatham County is an area which is very diverse - from lively and dense locations such as Savannah and quiet, serene neighborhoods like Windsor.
Ultimately, we landed on a question that guided us to make future solutions:
How do we make the American Red Cross our Neighbor?
प्रोपोज्ड सोल्युशन्स
Creating a solution
4 weeks in the project, we needed to propose solutions, something more concrete. This was a challenging task, since all the concepts we discussed so far were vague. For this phase, I spearheaded the development of three possible solutions, spanning from safe investments to high-risk high reward investments.

Safe Harbor
Operations of a singular resiliency hub in Chatham county

Ports in the Storm
Decentralizing resiliency hubs for all non-profits in Chatham county

Every Block an Island
Every Neighbourhood led relief efforts supported by the American Red Cross

After a long, detailed presentation, we gave the representatives some time to think about all the options. Ultimately, they went ahead with 'Ports in a Storm' and 'Every block an Island'.
What we created was completely new, and required creating new programming to accomodate these new solutions. Hence, we created the Emergency Support Program.
Emergency Support Program
We converted these concepts into actual initiatives that could be marketed externally and within the brand voice.
Resource Hub Initiative
For denser neighborhoods surrounded by businesses
Neighborhood Network Initiative
For suburban communities located in less dense areas
The Timeline
After understanding what we wanted our programs to do, My team and I brainstormed on how we would enroll this program in Chatham County. We created short, mid and long term goals to make the Emergency Support Program successful.

We created a detailed guidebook to implement these programs for the American Red Cross as well as other non profits/individuals who may be interested in implementing this program elsewhere.
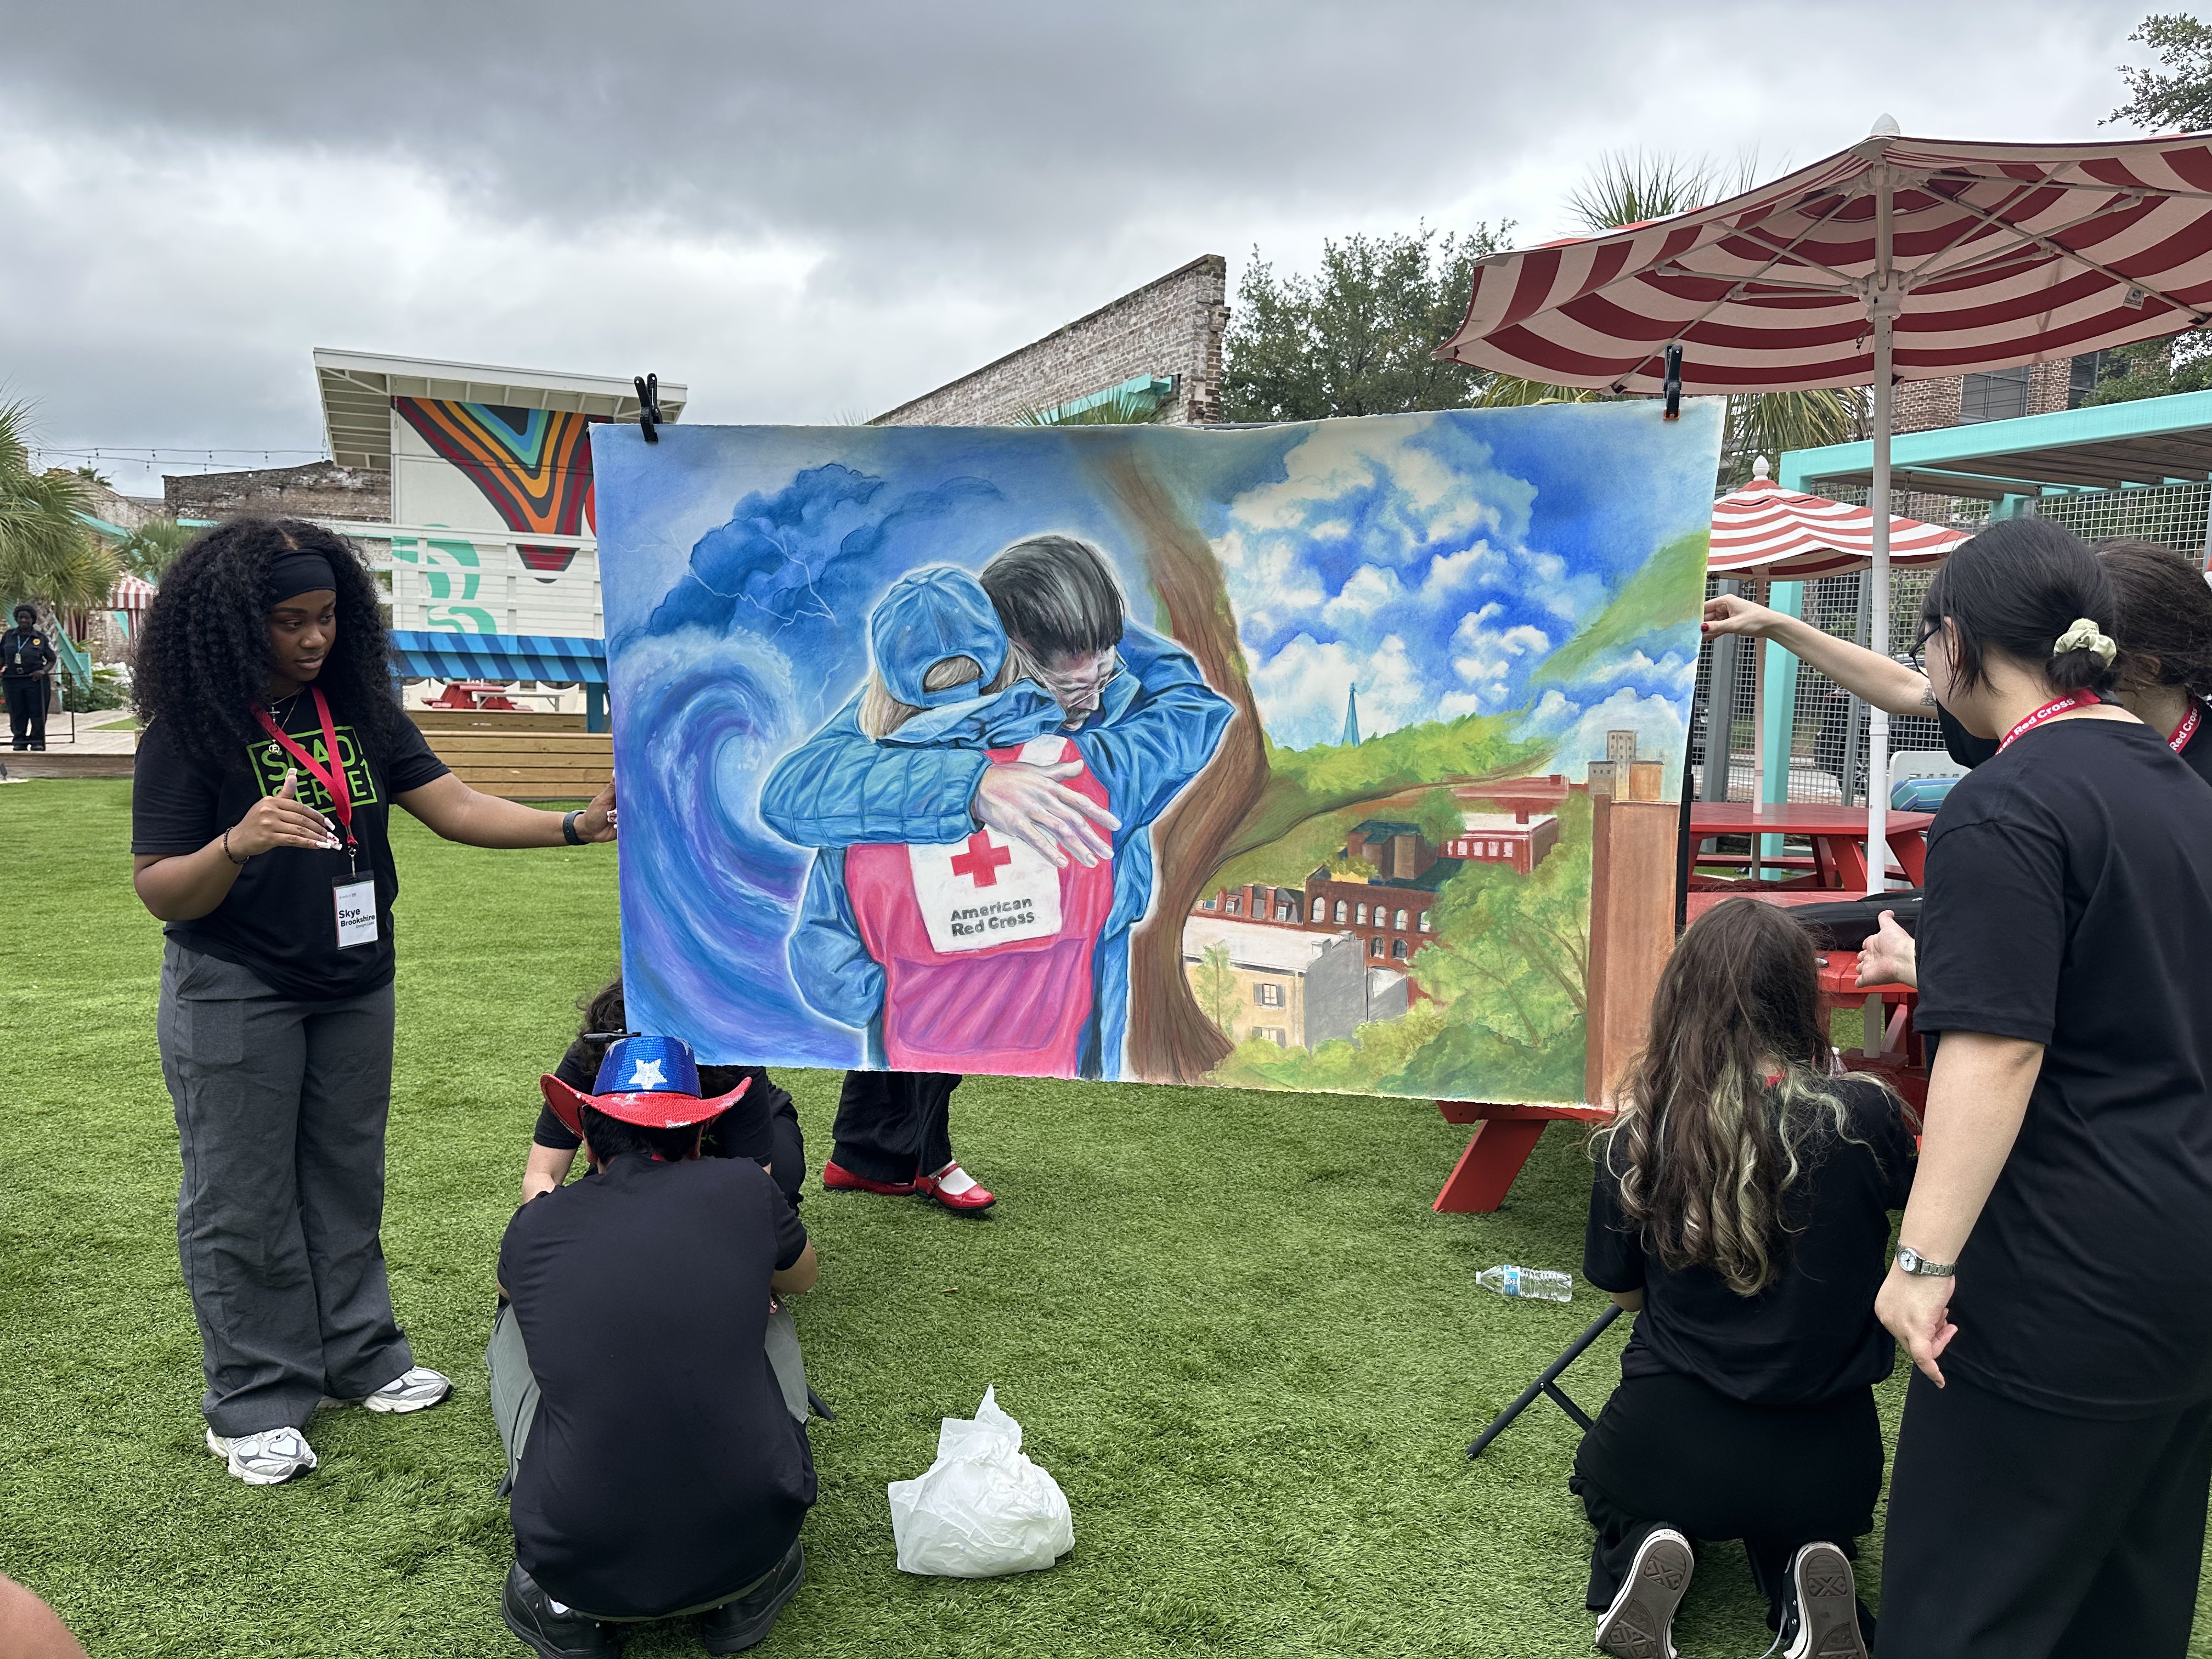
सोल्युशन देणे
Giving a solution
To really understand the impact this program can have, we made the final presentation two fold: a slide deck presentation narrating a story, and then an outdoor experience where you can 'live' that story.
मी काय शिकलो
What I learned
Establishing emotional connection
Before the project officially kicked off, everybody talked about their previous experiences with a natural disaster. This helped all of us feel even more connected to the project, and really make it our own.
Identifying peer strengths and interests
Being my first time being in a lead position at a high level, multidisciplinary project felt scary at first. Since most team members were on the creative side, I tried to understand their interests and shape the research work accordingly. It was a massive success, and the research we did was more in-depth and fruitful as a result.

Thank you for reading!
तुम्हाला कदाचित हे आवडेल